Radically Improving Application Performance with Enterprise AIOps
Today’s enterprise edge is incredibly complex. As global users work from anywhere, their devices create tremendous amounts of data, originating from wireless LANs, LAN switches, routers, firewalls, and countless cloud and SaaS applications.
Analyzing this data and extracting meaningful, actionable insights creates a major challenge for maintaining business continuity across distributed workforces. Only by harnessing the power of correlation and enterprise Artificial Intelligence for IT Operations (AIOps) can users rapidly remediate and heal their networks.
A Step-by-step Approach to Employing AIOps
How do you launch your enterprise AIOps journey?
Step one: Understand which apps are available. Using a DPI engine running inside an edge network intelligence crawler will help you identify and catalog your apps, pulling in their data to measure performance.
Step two: Apply advanced machine learning and engage the AI/ML engines to correlate across your application stack, determine app baseline behaviors, recommend corrective actions, and predict benefits. This is where the magic really happens.
Step three: Find the flaws. Ultimately, when an app’s performance deviates from its normal behavior, you want to be alerted. Now that you have a baseline, any deviations from your baseline will be revealed during anomaly detection, as well as the root cause analysis. From those flaws, you can extract metrics to understand how your app performance changed.
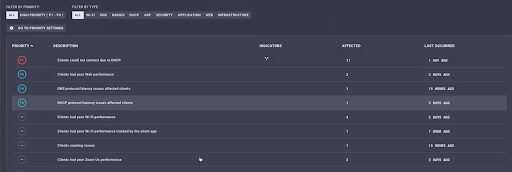
Figure 1. Incident showing client experiencing poor zoom performance.
Step four: The final step in this self-healing journey today delivers recommendations on how to improve your app’s performance, based on industry data insights. In the near future, we will automate some of the remediation steps.
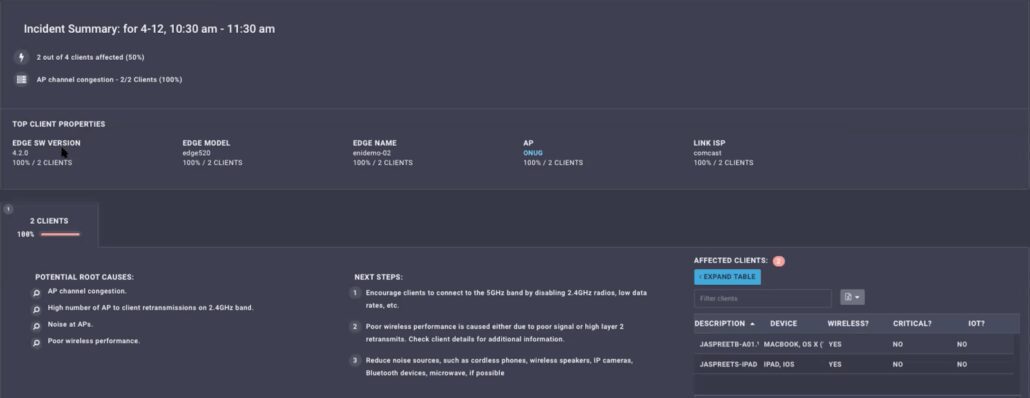
Figure 2. Display of potential root causes, along with recommended next steps using the AIOps engine.
We can also observe the same metrics from the client’s perspective using the ENI client app.
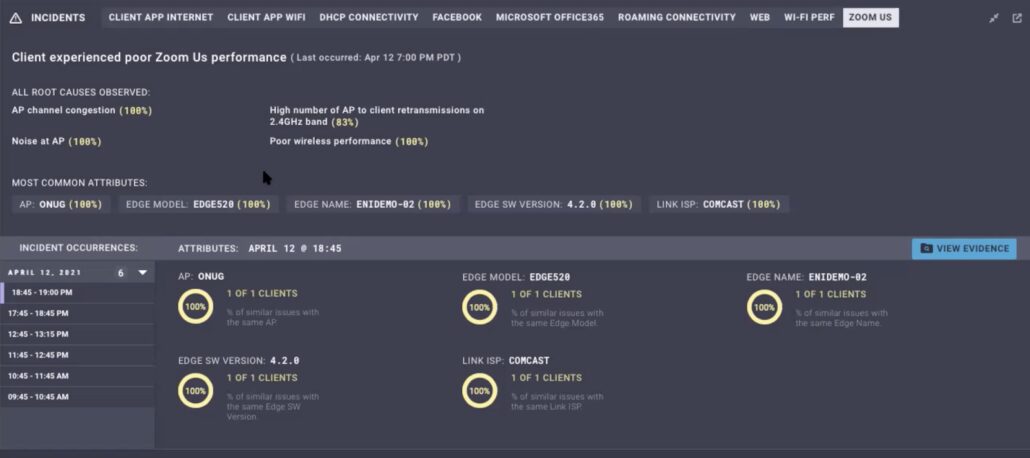
Figure 3. Client’s view of the Zoom performance incident.
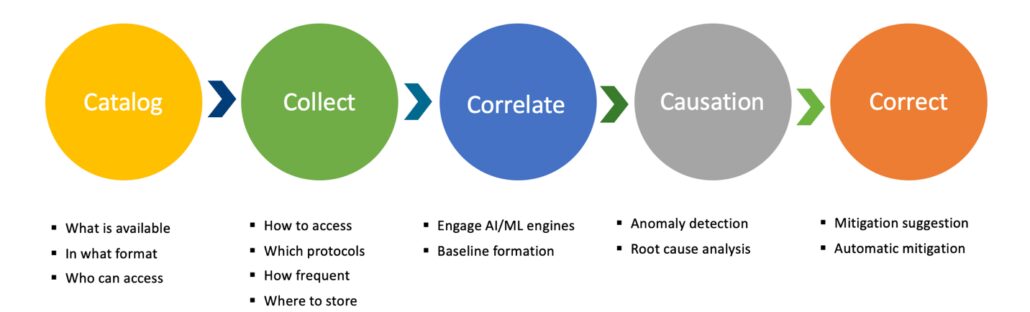
Figure 4. Steps in the Enterprise AIOps journey.
Case Study: Improving Zoom App Experience Using AIOps
In support of a client who experienced poor Zoom performance, we recently ran a demo which showcased how an AIOps engine received data feeds from many different sources and then automatically correlated the feeds to generate critical remediation steps.
Their enterprise AIOps journey began by pulling in data feeds from four key points, including data from the client app, wireless LAN metrics from the Mist APIs, and packet data from the VMware Edge, which integrates a built-in crawler and data from the Zoom APIs. Additionally, the client received data from switches, network services, and other devices.
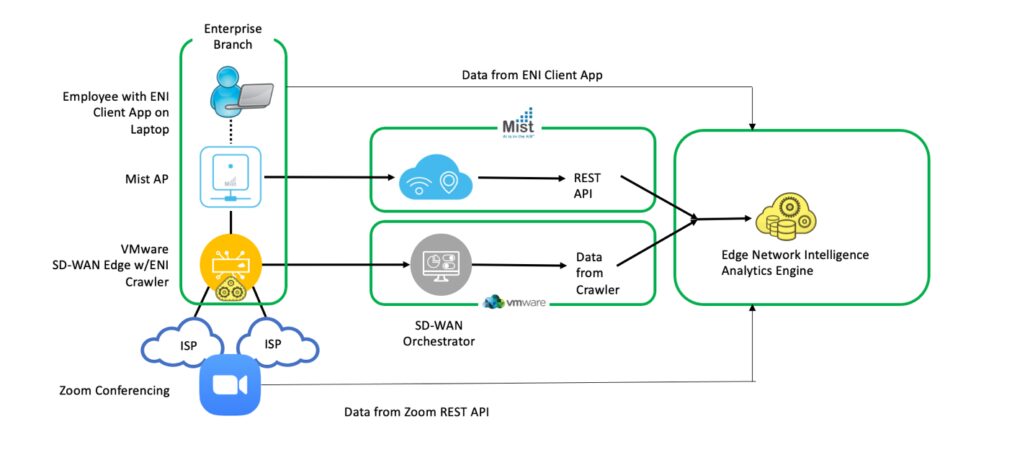
Figure 5. End-to-end network topology for Zoom application performance testing.
Next, the AIOps’ quick intelligence analytics engine ingested the data feeds and automatically ran the correlation, during which the engine analyzed the data received from the Mist API that detailed the Wi-Fi issues, linking it to the unsatisfactory Zoom performance.
Ultimately, the engine detected numerous anomalies. First, the client operated in a poor coverage area, experienced AP channel congestion, suffered significant AP noise, endured a long round-trip time to the cloud, and had poor wireless service as their device had not connected to five gigahertz. Additionally, the client app reported bad internet performance due to dropped pings and high latency.
After examining all the data, remediation recommended usage of the five gigahertz band and reduction of the noise sources, which helped to radically improve the client’s subsequent Zoom experiences.
Drilling Even Deeper with Custom Sets
Custom sets, another very powerful tool, took the demo findings to another level. After collecting Zoom API data, client app data, and Wi-Fi data, our engineers correlated the evidence manually to really dig down deeper and go into the weeds, narrowing their view down to a particular snapshot in time. For example, let’s say the client had Zoom performance issues at 6:30pm on April 12th.
First, our engineers examined the Wi-Fi charts during that time to assess any abnormal occurrences. They saw that the AP channel utilization bounced all over the place. Equally erratic, the SNR dipped below 20 dB, which can be problematic. In this case, it dropped to just two dB, creating a definite issue. Additionally, the noise floor and ping packet loss continually increased. Ultimately, the Wi-Fi experienced many challenges, which led to the Zoom app crashing many times.
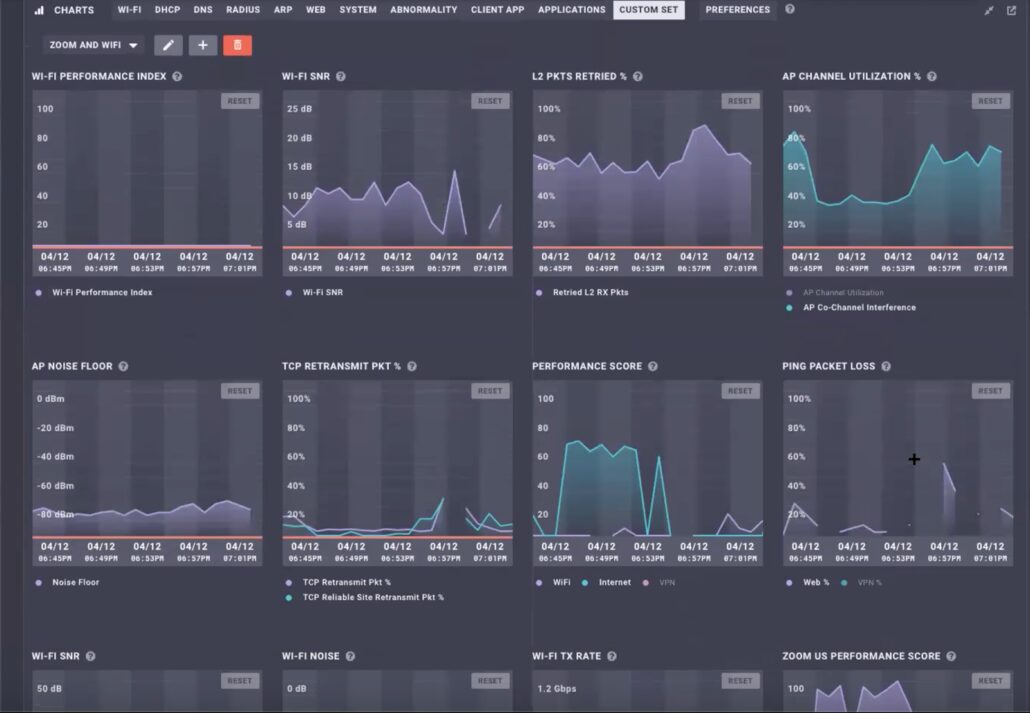
Figure 6. Custom set defined for Zoom application performance.
Clients around the world continue to rely on the power and speed of AIOps and machine learning. As AIOps’ analytics engine consumes volumes of data from many different sources, runs correlations, and forms a baseline, users rapidly receive results and recommended steps for fixing the issue, driving improved productivity and enhanced performance across their organization.
Author's Bio